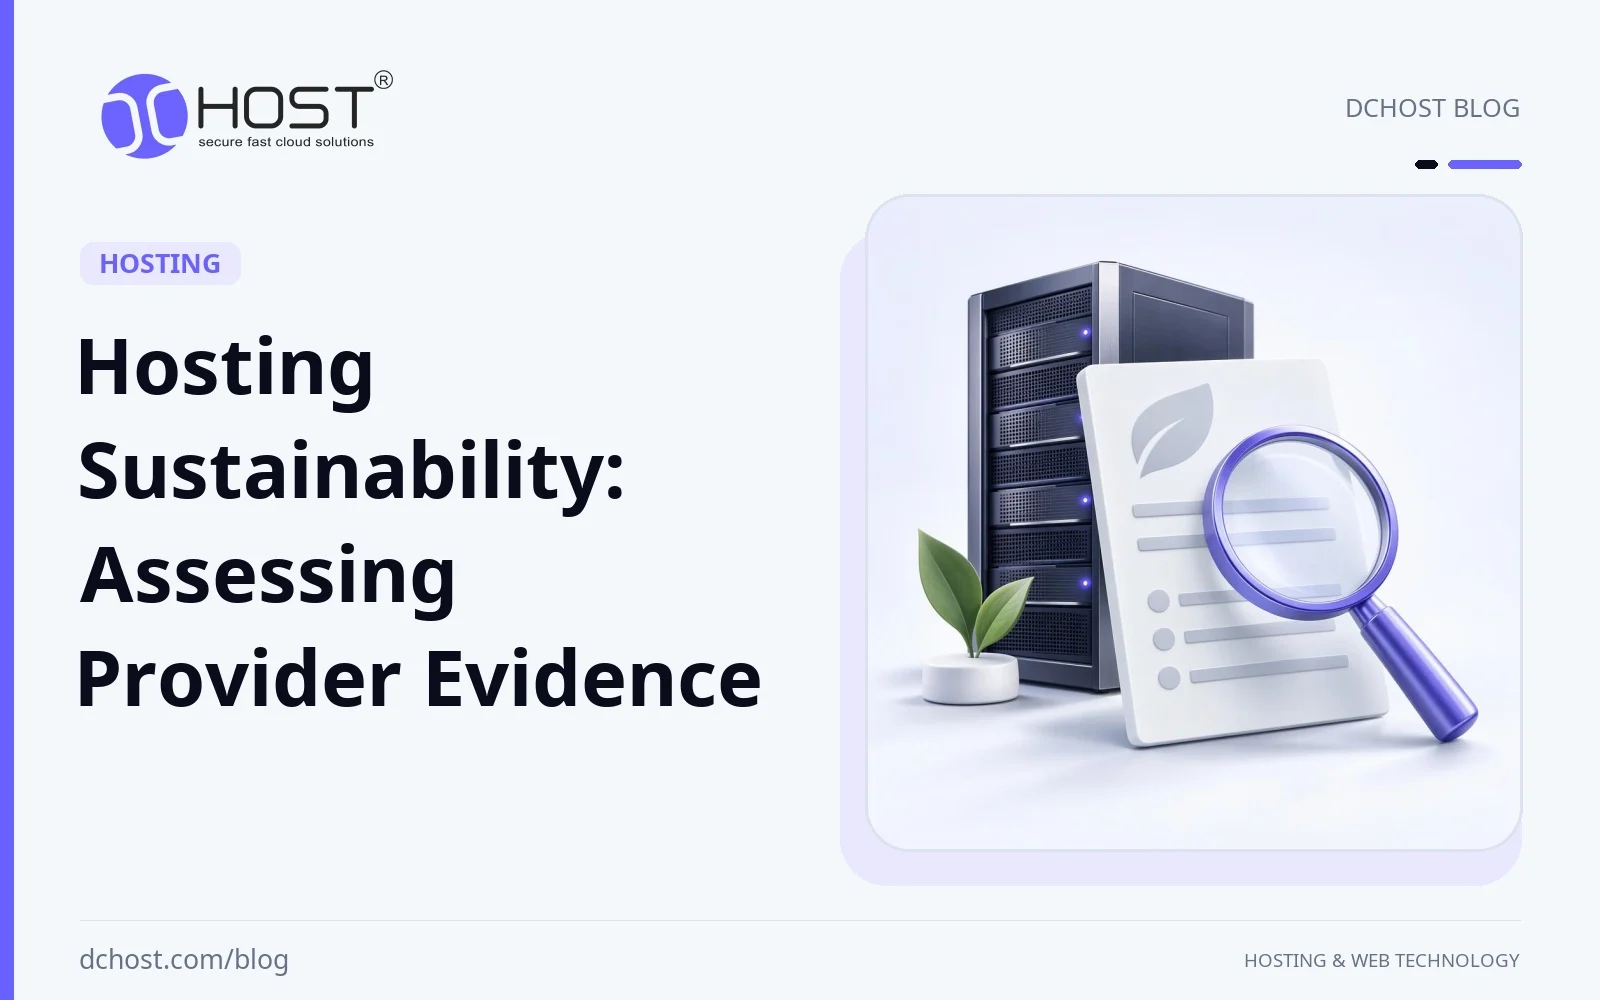
Assessing hosting sustainability evidence means connecting each provider claim to a defined site, period and method. This guide builds a comparison record for energy, water, electricity procurement and hardware policies. It explains which documents to request, when two figures are comparable and how to leave a decision conditional when evidence is missing. Apply environmental criteria alongside the performance, support and recovery requirements of your service.
Why Data Center Sustainability Matters
Data centers are energy‑intensive by design. Servers, storage, networking, cooling, power conversion and redundancy all consume electricity around the clock. As digital demand grows, so does the pressure to make that energy use cleaner and more efficient.
Three considerations make data center sustainability initiatives relevant to infrastructure planning:
- Regulation and reporting: Energy-efficiency, environmental reporting and emissions obligations depend on the jurisdiction, facility and organization. Buyers should establish which requirements apply and what data they need from providers.
- Cost and risk: Electricity is a significant data center operating cost. Inefficient facilities can be more exposed to energy price changes, while grid constraints can affect capacity planning.
- Customer expectations: Organizations with sustainability targets need infrastructure information that supports those targets. Carbon-intensive electricity and an undocumented improvement plan can make assessment harder.
For the facility basics, see what a data center is and why it matters for hosting. Here the practical output is a provider evidence record. Detailed keep-or-replace calculations belong in the separate CUE and server lifecycle decision guide.
Metrics for Evaluating Data Center Sustainability
Measurement makes a claim easier to assess, but only when its scope is clear. Start by distinguishing measured results, estimates and design targets. The following metrics answer different questions and should not be compressed into a single unsupported green score.
PUE: Power Usage Effectiveness
Power Usage Effectiveness (PUE) compares total facility energy use with IT equipment energy use over the same reporting period. A power-based snapshot can be calculated as:
PUE = Total facility power / IT equipment power
As a hypothetical example, a total facility draw of 1.5 MW with 1.0 MW going to servers, storage and networking gives an instantaneous PUE of 1.5. This is not a DCHost measurement or an annual energy result. The closer PUE is to 1.0, the smaller the support load relative to IT power in that snapshot.
Options for reducing facility overhead include:
- High‑efficiency UPS (uninterruptible power supply) systems
- Better airflow management (hot/cold aisle containment)
- Free cooling and advanced chillers
- Shorter power distribution paths
PUE is a facility-overhead indicator, not a complete sustainability measure: it does not show the electricity’s carbon intensity or how much useful computing work the IT equipment performs per unit of energy.
WUE: Water Usage Effectiveness
Water Usage Effectiveness (WUE) tracks water use per unit of IT equipment energy, commonly expressed as liters per kWh over the same reporting period. Ask whether the reported figure covers site water use alone or also includes water associated with electricity generation, and which water sources are counted. It complements PUE, especially where cooling consumes water in water-stressed regions.
Water-management options include:
- Reduce or eliminate the use of potable water for cooling
- Use recycled or reclaimed water where possible
- Adopt cooling designs that minimize evaporation losses
Carbon and Energy Mix Metrics
Efficiency is only part of the story. Another factor is how the electricity is generated and accounted for. Useful measures include:
- Carbon intensity: Emissions per unit of electricity, expressed in gCO₂/kWh or gCO₂e/kWh depending on which greenhouse gases are included. Check the emissions scope and reporting period.
- Renewable share: The renewable portion of electricity supply or procurement. Ask whether the figure describes on-site generation, the regional grid mix or contractual matching; these are not interchangeable.
- Location-based vs market-based emissions: Location-based figures reflect the regional grid mix; market-based figures reflect qualifying contractual instruments and applicable accounting rules. Annual renewable matching does not establish renewable supply in every hour.
Compare these measures alongside PUE rather than choosing on a small PUE difference alone. Ask for matching reporting periods, measurement boundaries and supporting documentation before comparing facilities.
Ask for Evidence Behind Hardware and Facility Claims
Physical infrastructure offers several sustainability levers: servers, cooling systems and power distribution. Careful engineering can reduce energy demand and associated emissions, but operating cost and reliability effects need separate evaluation.
Server Performance Is Not an Energy Measurement
Newer hardware can deliver more performance per watt, depending on the workload and configuration. This is a useful criterion when refreshing fleets for shared hosting, VPS and dedicated servers. Newer CPUs and storage can allow fewer servers to handle the same workload with lower total power draw. The overall sustainability benefit also depends on utilization, service life and the impacts of manufacturing and retiring hardware.
Storage choice should be evaluated against the workload. Our NVMe VPS hosting guide provides related performance context, but an interface name or performance result alone does not establish energy savings. Compare the candidate drives and access patterns, then measure total system energy for the same completed work. Potential benefits to test include:
- Higher consolidation: more customer workloads per server
- Lower storage latency and less time waiting for I/O in storage-bound workloads
- Less hardware required to meet performance SLAs
Request system energy for the same completed work, service levels and representative load profile. For a refresh policy, ask for support dates, repair options and environmental declarations for the actual configuration. A full-lifecycle product figure may already include operating electricity; separate stages before adding your own electricity estimate. For reused equipment, request its destination and the need it replaces.
Cooling Innovations: From Hot/Cold Aisles to Liquid Cooling
Cooling contributes to a data center’s non-IT energy consumption. Assess its measured share of facility energy use when prioritizing airflow and cooling improvements.
Common initiatives include:
- Hot and cold aisle containment: Organizing racks so that server intakes face each other and exhausts face each other, then containing the cold or hot aisles to limit mixing. This can permit higher supply temperatures and more efficient cooling, provided measured equipment inlet temperature and humidity remain within manufacturer limits; room temperature alone is not sufficient.
- Free cooling: Using suitable outdoor conditions through air-side or water-side economizers to reduce compressor operation. Availability depends on climate, humidity, air quality, filtration, equipment requirements and system design.
- Variable-speed fans and pumps: Adapting speed to the actual load rather than running continuously at full speed.
- Liquid cooling, including direct-to-chip systems: For dense compute such as AI training clusters, liquid cooling can help remove concentrated heat. Total cooling energy and water use depend on the complete system, including heat rejection outside the server room.
Where dense AI or HPC workloads are planned, assess cooling requirements before selecting racks and facilities. Check electrical capacity, liquid distribution, maintenance access and heat rejection rather than assuming liquid cooling will automatically lower energy or water use.
Power Chain Optimization: Fewer Conversions, Less Loss
Every conversion from AC to DC, or back again, introduces losses. Power-chain design can aim to simplify the power path from the grid to the server motherboard while maintaining required protection and redundancy:
- High‑efficiency UPS systems, evaluated at expected loads and in the intended operating mode
- Better‑designed power distribution units (PDUs)
- Where practical, DC distribution to reduce conversion steps; busways can simplify distribution but do not inherently eliminate conversions
For server power supplies, request efficiency at the expected operating load alongside any 80 PLUS class. Redundant units may operate at different load fractions from a single-unit test. A class name alone does not quantify savings for a particular fleet; the configuration, load profile and measured result are the useful evidence.
Software, Network and Architecture: The Hidden Sustainability Levers
Application architecture affects resource demand, but the environmental claim needs a defined measurement boundary. Record which decisions belong to the application owner, hosting provider and facility operator so that an application metric is not presented as a facility energy reading.
Virtualization, Containers and Smarter Utilization
Under-utilized servers can consume substantial power even when mostly idle, depending on hardware and power-management settings. Virtualization and containerization can support workload consolidation:
- Multiple VPS or containers share the same physical host
- Idle resources can be allocated to bursty workloads
- Capacity can be right‑sized over time based on real monitoring data
Accurate capacity planning and monitoring help identify consolidation opportunities. Energy savings depend on reducing host power or retiring unnecessary capacity, while preserving performance, isolation and availability headroom.
Workload Placement and Data Center Selection
Not all data centers have the same environmental footprint. Locations differ in grid carbon intensity, climate, water availability and cooling requirements. Workload placement can account for these factors alongside latency, data protection and resilience requirements.
For example:
- Latency-tolerant batch jobs may be suitable for regions with lower electricity carbon intensity, subject to transfer costs and operational constraints.
- For data subject to rules such as GDPR or KVKK, assess applicable processing and cross-border transfer requirements before choosing a location. Local hosting alone does not establish compliance; environmental criteria should be applied within the legally suitable options.
- Failover and disaster recovery capacity can be right-sized, but required recovery objectives and independent failure domains must be preserved.
If you want to understand how regional choices intersect with performance and SEO, we explored this in detail in our article on how server location affects SEO and perceived speed. The same thinking now also applies to sustainability.
Network Efficiency and Modern Protocols
In-facility networking equipment is part of IT equipment energy use in PUE, alongside servers and storage; it is not a separate overhead category like cooling. An end-to-end assessment may also include networks and CDN infrastructure outside that facility, which are outside its PUE boundary. Several approaches can help improve network efficiency:
- Modern routing hardware: Newer switches and routers can handle more throughput per watt.
- IPv6 adoption: While IPv6 itself is not a magic sustainability button, its broader adoption supports network scalability. Any operational or energy benefits depend on the deployment.
- Protocol and caching optimizations: HTTP/2 and HTTP/3 can improve delivery performance; CDNs and caching can reduce repeated origin transfers and processing. Net energy savings depend on the workload and deployment.
For background, see our article on IPv6 adoption and what it means for your infrastructure. For sustainability, assess energy use across the relevant delivery path rather than treating protocol choice or reduced origin traffic alone as proof of savings.
Water, Location and the Bigger Environmental Picture
Sustainability is not just about electricity. Data centers also affect local water resources, land use and electricity infrastructure. Facility evaluations should account for these wider impacts.
Reducing Water Footprint
Cooling systems that use evaporation to reject heat can consume significant amounts of water. In water-stressed regions, this creates a resource trade-off even when the systems use relatively little electricity.
To address this, data centers can:
- Use air‑cooled designs where climate allows, even where this increases power use.
- Prefer reclaimed or non‑potable water when evaporation is necessary.
- Invest in control systems that adjust cooling strategies based on real‑time weather and load.
A facility with low PUE but high potable-water consumption cannot be judged best-in-class on PUE alone. Local water stress, sourcing and seasonal availability also matter, and reducing water use can sometimes increase electricity demand.
Choosing Locations with Structural Advantages
Regional climate, electricity supply and water availability can affect a facility’s options, but they do not establish its measured performance. Request the actual site’s evidence and apply environmental criteria within suitable latency, data-processing and resilience constraints.
When evaluating locations for new capacity, useful criteria include:
- Access to renewable power (wind, hydro, solar, geothermal)
- Cooler ambient temperatures for free cooling
- Strong connectivity to major internet exchanges
For related capacity context, the article on data center expansions and cloud demand discusses facility growth. An expansion announcement does not itself establish the sustainability results of the service you are evaluating.
Regulations, Standards and Certifications: What They Mean for You
Regulatory requirements, voluntary standards and certifications serve different purposes. Legal obligations depend on the jurisdiction and facility; participation in a voluntary scheme does not replace compliance. For any certification, check its scope, validity and which sites or operations it covers. None of these labels alone establishes a low environmental footprint.
Energy and Environmental Management Systems
Formal management systems can provide a structure for:
- Energy management standards (for example ISO‑style frameworks) to systematically track and improve energy performance.
- Environmental management standards to handle broader impacts such as waste, water and emissions.
For customers, the value is not the logo on the website but the underlying discipline: regular audits, documented improvement plans, and clear accountability inside the organization.
Data Center‑Specific Codes of Conduct
In some regions, voluntary codes of conduct for data centers cover practices such as:
- Design guidelines for efficient cooling and power
- Operational best practices for monitoring and optimization
- Guidance on monitoring and reporting efficiency metrics such as PUE and WUE, depending on the scheme
These schemes can support continuous improvement, but the commitments and review processes depend on the scheme. This aligns well with the reality of data centers, where loads, technologies and external conditions are always changing.
Build a Provider Evidence Record
Use this blank template for each candidate provider. It contains questions, not ratings or provider results. For every row, add the source document, date, data owner, measured/estimated status and unresolved gaps. Missing evidence is not a measured zero.
| Claim or measure | Evidence to request | Comparability check |
|---|---|---|
| PUE and total energy | Site, period, facility and IT energy, meter boundary | Annual measurement, snapshot or design target? |
| Water and WUE | Water quantity, source, period and IT energy denominator | Site or source boundary; local water stress and season? |
| Electricity emissions | Separately labeled location-based and market-based results, factors and sources | Same method, year, geography, gas coverage and units? |
| Renewable electricity | Grid mix, on-site generation or contractual instruments | Attribute ownership, matching period, region and double-counting controls? |
| Hardware policy | Support, repair, refresh, reuse and retirement records | Actual configuration; manufacturing separated from operating impact? |
| Customer-level impact | Allocation method and included resources | How were site totals assigned to a VPS, customer or completed transaction? |
| Certificate or target | Scope, validity, responsible owner and review date | Relevant site and activity; target separated from achieved result? |
PUE and WUE are facility ratios; neither assigns emissions to an individual customer. If a provider reports impact per VPS or transaction, request its allocation method, included storage and networking, and service quantity. If direct measurement is unavailable, preserve the estimate and its limitations instead of presenting it as a reading.
Connect Provider Evidence to Your Workload
Hosting providers influence facility selection, hardware deployment and service architecture; application owners influence workload design and requested capacity. Sustainability improvements depend on coordinating those decisions and checking their measured effects.
Check Who Can Substantiate Each Result
Providers, facility operators and application owners may hold different parts of the evidence. Establish who supplies and updates the following:
- Facility records: Site-specific energy, water and electricity sourcing data with reporting boundaries.
- Hardware records: Delivered configuration, workload-energy comparison, support window and retirement route.
- Capacity records: Observed demand, peak-load headroom and maintained failure domains.
- Application records: Completed work, response quality and the actual effect of optimization across the defined service boundary.
For an operations‑focused discussion, you can read our earlier article The Quiet Revolution in the Server Room: Data Center Sustainability Initiatives That Actually Work.
How You Can Align Your Workloads
Your architecture and coding choices have a direct impact on how efficiently the underlying infrastructure can run. Some practical steps you can take:
- Right-size your hosting plan: Avoid massively over-provisioned servers that sit idle. If you are unsure how to size your VPS or dedicated server, our guides on capacity planning and performance tuning are a good starting point.
- Use caching and CDNs: Reducing unnecessary origin hits and database queries can lower origin CPU usage and power draw; the overall energy effect also depends on the CDN and network resources used. Exclude personalized, session-specific, cart, checkout and account responses from shared caching, and validate freshness and invalidation rules. We have covered practical CDN caching strategies for WordPress and WooCommerce that can help reduce origin workload.
- Keep software updated and efficient: Maintain supported PHP, database and runtime versions. Test upgrade compatibility and measure performance and system energy for the same workload rather than assuming a newer version reduces capacity needs. Preserve redundancy requirements.
- Consolidate where it makes sense: Instead of many tiny under-utilized VPS instances, consider fewer, well-tuned servers with proper isolation and monitoring, while preserving availability and peak-load headroom.
These optimizations can reduce resource demand. A smaller overall footprint depends on whether those savings translate into lower energy use or reduced hardware requirements across the relevant infrastructure.
Decide What the Evidence Supports
Mark each claim comparable when the method, period, facility boundary and relevant service conditions align. Mark it conditional when a known difference needs explanation or adjustment. Mark it insufficient evidence when a necessary measurement, method or document is missing. This is a buyer workflow, not a certification scheme.
For example, a measured annual PUE and another site’s best-hour design target do not support a numerical ranking. Request a measured annual result on a compatible boundary and leave the comparison conditional until it arrives. Likewise, annual certificate matching and the regional renewable grid share describe different things. A low PUE cannot fill in missing water data.
Record the chosen service, supporting documents, open conditions, decision owner and review trigger. Revisit the assessment when the facility changes, a certificate expires, a new reporting period arrives or the workload changes materially. The U.S. Department of Energy design guide explains facility metrics, while the GHG Protocol Scope 2 Guidance explains electricity accounting. Contractual allocation of emissions is separate from proving that a purchase caused new renewable generation.
If you are planning a new project, migration or capacity expansion, use these metrics and questions to compare hosting options. Ask our team about requirements and available services, and request the facility-level evidence needed for your sustainability assessment. Choose an architecture that meets performance and resilience needs, then evaluate its environmental trade-offs rather than relying on a green label.